As hockey, politics and surveillance companies use data to try to determine things about the world, data literacy is gaining importance.
Living Sky School Division Learning Consultant Doug Drover recently gave a presentation about data collection and interpretation. The school division was the topic of his presentation, but much of what he said applies to other circumstances, such as politics and economics.
"Part of my job to ask what are some of the problems with this data, what do we have to be careful of, and what to take at face value," Drover said.
The presentation began with a slide "Fun With Data," and Drover went over topics such as the pros and cons of using data in education, and common mistakes when data is used.
Drover showed a slide with a quote attributed to Mark Twain: "get the facts first then you can distort them as much as you want."
"The person who owns the data gets to interpret it," Drover said.
Drover also cautioned against reading too much and too little into what numbers might and/or might not show.
Drover made the distinction between data, which he considers "just information," and evidence, something that's useable, "and you always want to be able to use it."
Evidence comes in many forms, and numbers tell only part of the story. The other half is experiences and observations, Drover said.
Data Often Noisy and Dirty
A common mistake in data collection is that it isn't collected in a systematic way or data accumulation is rushed. A problem for the school division is the data they obtain is "often noisy or dirty."
"Noisy [means] there are lots of things going on so it's not easy to draw one-to-one conclusion, and dirty means there's a lot of errors, and that happens," Drover said.
Figuring out student address information can be troublesome since administration assistants from the across the division enter the information approximately 35 different ways. Similarly, student outcome data can be difficult to interpret because it's made of "the marks of 90 different teachers with slightly different expectations."
Another problem with data is "stretching something beyond what it was intended to be."
"For example, we collect information on student reading scores and some of it becomes an evaluation on whether than teacher is a good teacher," Drover said. "Teacher evaluations aren't based on reading scores or writing scores or math scores."
"Just because the data says something, doesn't mean that's the truth and we shouldn't extrapolate from it."
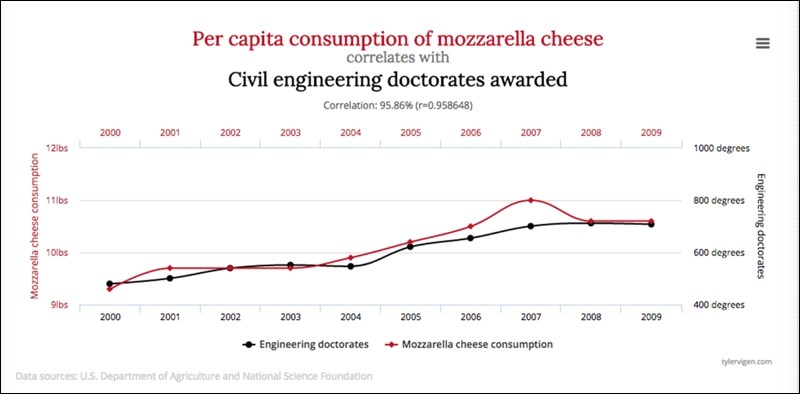
Drover showed a graph demonstrating the correlation between per capita mozzarella cheese consumption and civil engineering doctorates awarded.
"If you jump to a conclusion, you could say we need to fund a mozzarella cheese program in our schools to increase the number of civil engineers," Drover said. "But one of the issues with data, if you look at stuff moving around over time, is it’s not always a one-to-one causation. It's not that one thing causes another.
It's important to step back and ask yourself, is one really causing another, or is there something else that's at play."
Drover said "we see a lot of that in our schools."
"For example, there's a school that might have really strong math scores, but it's not necessarily because the math instruction is very good. It just so happens that there's a lot of kids at that school that go home and do a lot of math homework."
The idea also applies to reading, Drover said.
Another graph showed little information apart from a line representing "my overall health" which declines rapidly at a point labelled "the day I realized I could cook bacon whenever I wanted."
Drover asked why the graph might be misleading. Board member Ken Arsenault said, "you could have got hit by a bus that same day."
Drover said that was a possibility, given that the graph had so little information.
In another example, ice cream consumption is correlated with drowning deaths in Saskatchewan. Rather than one thing necessarily causing the other, the two are correlated because both happen in warm weather.
Rules of Thumb
Drover had four rules of thumb about data in relation to the school division: don't get excited unless there's a change in 10 percentage points, "because there's a lot of noise in our data and a lot of reasons why things go up and down;" look for the trend over time, not the change year to year, as the differences from one year to the next in a lot of Living Sky's data involves a different group of kids sampled in the next year; always question the quality of data and why it might have problems; and avoid confirmation bias.
Confirmation bias is the tendency to search for or interpret information that supports what one already believes to be true.
Arsenault said of the data available to the school division, cohort data was useful for him. Cohort data involves collecting information from students over time.
Drover said he used to collect cohort data but stopped because transient students tend to leave the cohort the longer the division tracks the cohort. To some extent, Drover said, such data can resemble the cheese and engineering degree correlation.
"We'd like to think the longer the kids stay with us the better they'll do, and that's partially true," Drover said. Rather, such cohorts don't effectively track the transient students and can give a misleading impression of reality.
"But the smaller the cohort gets, the more and more you just get kids that are from stable two-parent families whose families have jobs and are sticking around here for a long time."
Graduation Rates
Regarding graduation rates, Drover said the Ministry of Education locks students to schools, despite students moving from school to school. Drover said that approach works for looking at provincial numbers, but not necessarily for Living Sky since the division has students coming out of four different school systems. Living Sky, Drover said, uses its own formula for calculating grad rates.
Living Sky has worked to establish baseline data from which to measure changes, although such baselines have changed over the years for various reasons.
"My problem with the data now is there's too many variables, and then the government throws in a variable, and changes the grades, so if you can remove as many variables from collecting the data then the data should be more consistent," Arsenault said, suggesting Drover meet with "data counterparts" and talk to the Ministry of Education about such matters.

