Regina – Saskatchewan’s Chief Medical Health Officer presented new modelling of the impact of the COVID-19 pandemic in Saskatchewan. The Ministry of Health released modelling number in April, and while they have continued to work on them since February, this is the first public release of new modelling figures since April. Those models show several scenarios with significant spread of the virus in the short term and over six months.
This modelling was presented as Saskatchewan, Manitoba and North Dakota have been experiencing exponential growth in new cases of COVID-19 in recent months. Saskatchewan is roughly 17 to 18 days behind Manitoba’s 7-day average of new cases for the period of Oct. 1 to Nov. 15. In recent days, Manitoba has instituted a new lockdown and told stores they are only allowed to sell essential items.
With the possibility of two different vaccines are on the horizon, Minister of Health Paul Merriman, speaking in the Legislature, said, “The federal government has secured an initial batch of six million doses, to be delivered in the first quarter of 2020. Four million are from Pfizer and two million from Moderna. Of those, Saskatchewan will receive approximately 180,000.
“Sask Health and the SHA are developing a plan to deliver the vaccine as swiftly and effectively as possible. The vaccine would be administered on a priority basis. I expect we would be vaccinating seniors and front-line health workers first.”
Merriman said it’s going to take some time to get the entire province vaccinated, “And until then, we need to follow all public health measures and guidelines that will help keep us safe, and those around us safe.”
Shahab said the modelling is not a prediction, but showing some possible scenarios, stating. “What we do today starts changing the model, because the imputation is dependent on all our actions.”
He also said, “This is really our first real wave. For many jurisdictions, it's been the second wave, for us I would submit that this is our first true test and we have prepared well, but we are now being tested both as residents of Saskatchewan, obviously, the healthcare system.”
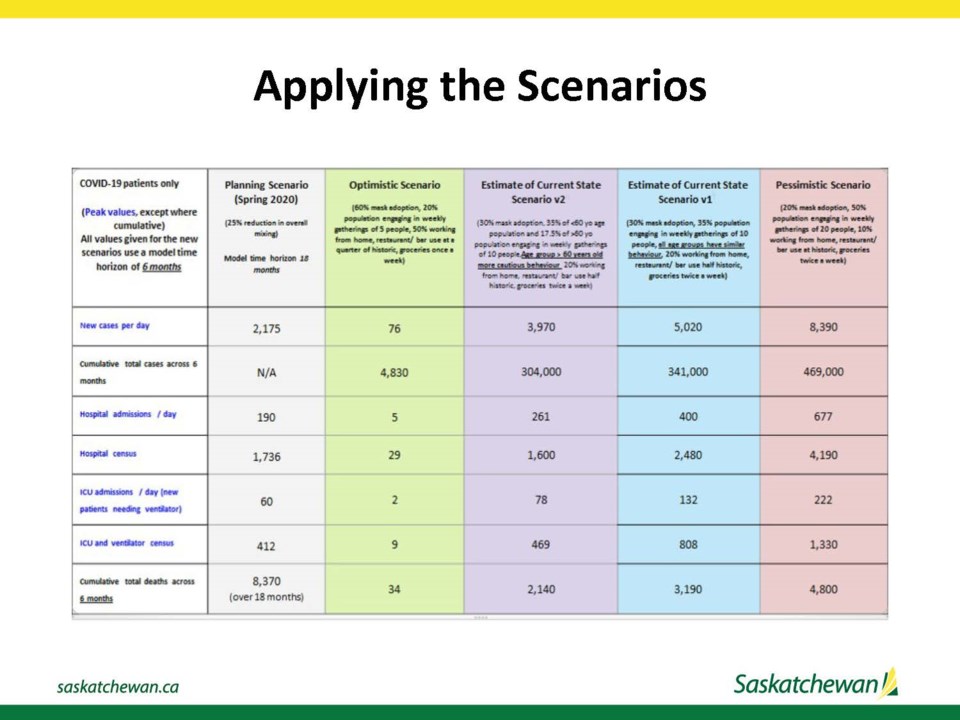
Four scenarios going forward
Looking out six months, the province laid out four possible scenarios as well as its spring 2020 planning scenario. The four new ones are termed “Optimistic, Estimate of Current State v1, Estimate of Current State v2, and Pessimistic.”
All the models assume schools and businesses are open and there continues to be mixing occurring at home, work, schools, hospitals and long-term care homes.
The spring planning scenario saw peaks of 2,175 new cases per day, 190 hospital admissions per day, 1,736 in hospital at one time, 60 people admitted to ICU per day, and 412 people in ICU needing a ventilator at a one time. It also suggested up to 8,370 deaths over 18 months.
The optimistic scenario shows much lower numbers than what is currently happening in Saskatchewan today, as nearly every item has already been exceeded. It suggested 76 new cases per day (Nov. 19’s 7-day average is 174.4), five hospital admissions per day, 29 in hospital at one time (Nov. 19 had 83 in hospital, up from 76 the day before), two people admitted to ICU per day (Nov. 19 had 21 people in ICU, up from 17 the day before), and nine people in ICU and on ventilators at a one time. It also suggested up to 34 deaths over six months (To date, Saskatchewan has had 32 deaths).
The current states scenarios have significantly higher numbers. The estimate of the Current State, Version 2, is less harsh. It forecasts peaks of 3,970 new cases per day, cumulative 304,000 cases, 261 hospital admissions per day, 1,600 people in hospital at one time, 78 ICU admissions per day and 469 people in ICU and on ventilators at one time. The cumulative total of deaths over six months is modelled at 2,140.
That last model is contingent on people over 60 years old partaking in “more cautious behavior.”
The current state, version 1 model, has even higher numbers. It projects peaks of 5,020 new cases per day, cumulative 341,000 cases, 400 people per day admitted to hospital, 2,480 people in hospital at one time, 132 people admitted to ICU per day and 808 people in ICU and on ventilators at one time. This scenario pegs total deaths at 3,190 over six months.
(Saskatchewan’s entire fleet of acute care hospital beds, not counting the two field hospitals on warm standby, is just over 2,900, as of 2018.)
The pessimistic scenario forecasts peaks of 8,390 cases per day, with cumulative 469,000 cases, 677 hospital admissions per day, 4,190 people in hospital at one time, 222 ICU admissions per day requiring a ventilator, 1,330 people in ICU and on ventilator at once, and 4,800 deaths over six months.
The optimistic scenario is based on many of the measures the province had been pushing. It’s based on 60 per cent mask adoption, 20 per cent of the population engaging in weekly gatherings of five people, 50 per cent of the population working from home, restaurant and bar use at 25 per cent historic usage, and people going for groceries just once per week.
A graph showing the modelling compared to the actual situation puts Saskatchewan on the “current state v1 track for new cases on Nov. 8, but close to v2 for the 7-day rolling averages on Nov. 11 and Nov. 14.
The presentation included graphs of 14-day forecasts going to Nov. 29 of new lab-confirmed cases and new acute hospital admissions. Both show a hockey-stick shaped climbing sharply at an exponential rate. The “forecasted value (50 per cent)” of new cases shows over 1,320 new cases per day by Nov. 29, and 90 hospital admissions per day. However, the new cases graph notes, “interpret with caution.”
Put in perspective, from publicly available data, North Dakota’s 7-day average of new cases on Nov. 19 was 1,386, and Manitoba’s was 386. For the period of Oct. 1 to Nov. 15, Saskatchewan’s rate of growth was close to Manitoba’s, but was slightly higher than our neighbour to the east. North Dakota’s 7-day average of new cases was higher, but had a lower rate of growth.


